Poverty line and GDP |
|
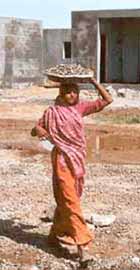
| Population below poverty line | 54,9 % (1973 - 1974) 35,0 % (1984 - 1999) 26,1 % (1999 - 2000) |
| Per capita GNP in US$ | 457 (2001) 568 (2003) |
Share of income/consumption |
|
| Share of income/consumption - richest 10% | 46 |
| Share of income/consumption - poorest 10% | 8 |
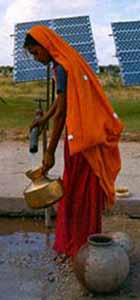
| In poverty (PPP US$ 1 a day) | 44 |
| Percentage of population below poverty line | 35 |
| Percentage of population not to survive up to 40 years of age | 17 |
GDP |
|
| National income GDP (1 US$ = Rs. 44.25605) | Rs 1,761,838 croers(99-00) Rs 2,523,872 " (03-04) |
| Share in GDP - Agriculture Industry Services |
29.0
% (1999-2000) 23.9 % (1999-2000) 46.8 % (1999-2000) |
| GNP | Rs. 1,771,028 croers(99-00) |
| Per capita income | Rs 16.047 |
| GDP growth rate in % | 6,1 ( 1990 - 1999) 5,3 (2001) |
| Inflow of foreign investment in US$ Bn. | 2.988 (2001-2002) 1,658 (2002-2003) 1,462 (2003-2004) |
| Exports in US$ Bn. | 39.8 (2000) 44.7 (2001) |
| Foreign exchange reserve | US$ 4.9 (1988) US$ 38,4 (2001) US$ 69,9 (2002) US$ 102,2 (2003) |
| Currency | Indian Rupee (Rs.) Exchange rate: 1 € = 53,38(Jan 2006) |
| Measurement and weight | The metric system |
| Source : Statistical Outline of India 2000 - 2001, Tata Services Limited, Department of Economics and Statistics |
|
Statistical outline |
  |